Health Check
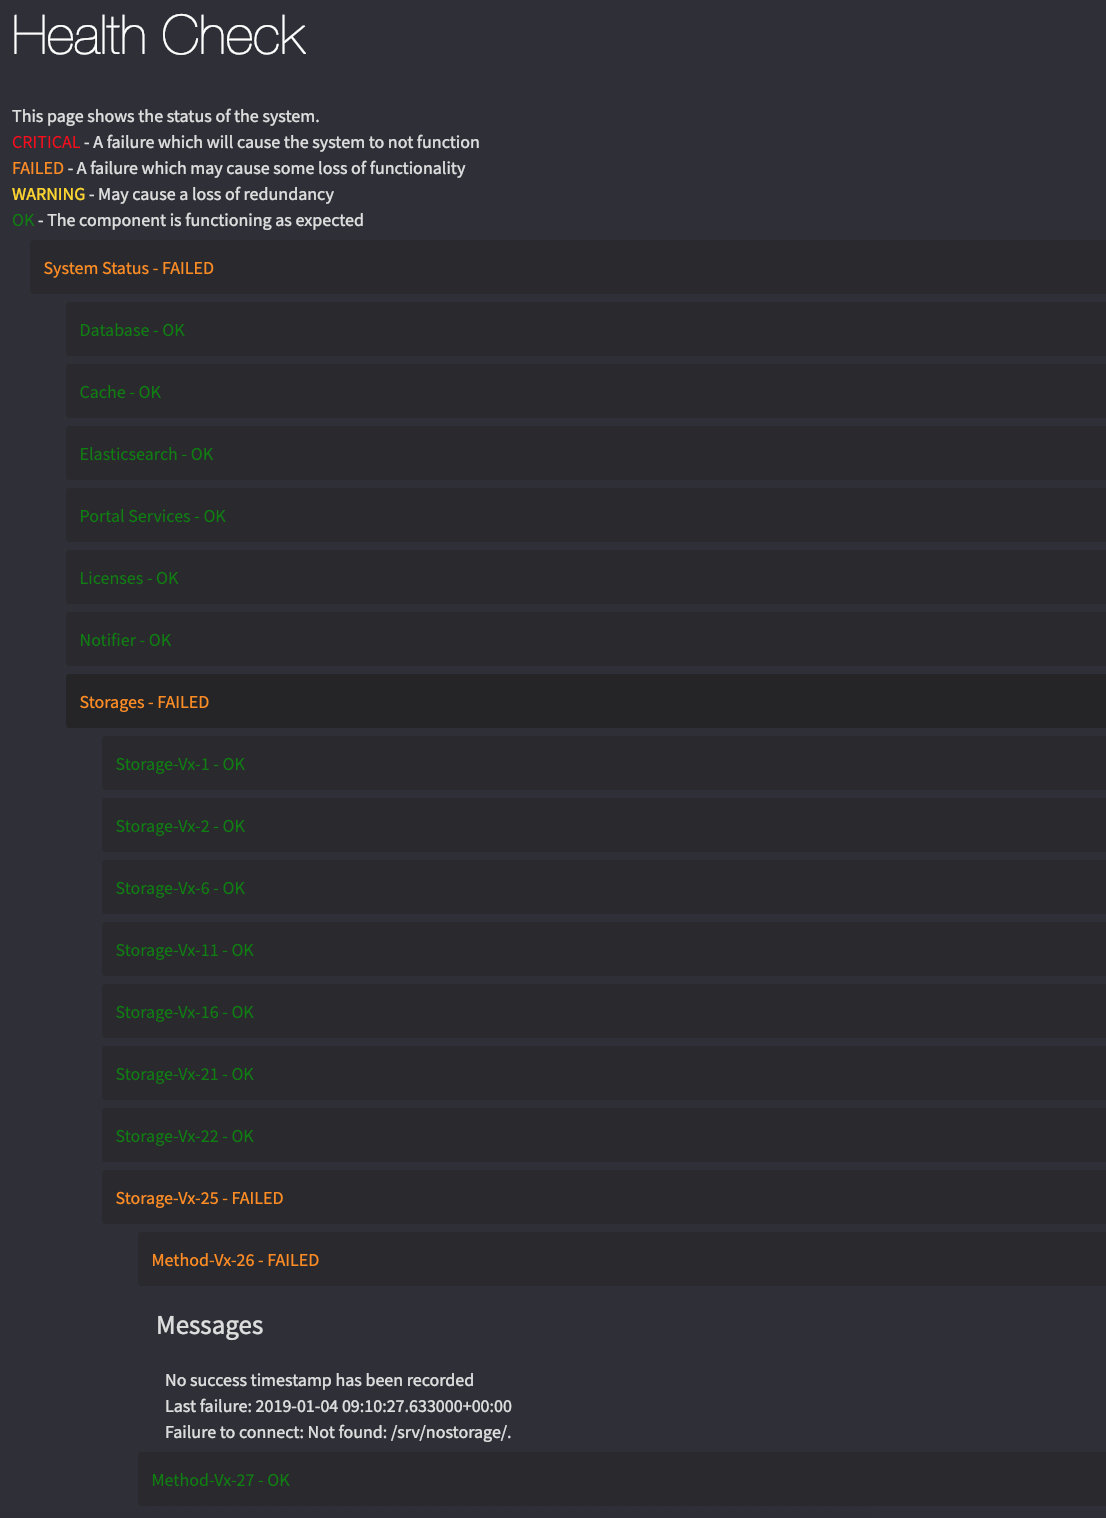
To help diagnose problems, Cantemo comes with a built in health check which verifies the different components of the system. This check can be reached via the System Overview option in the Admin menu. On the System Overview page, an aggregated status is shown to give an idea of the system status at a quick glance. By clicking on the status you can then open up the full Health Check page which allows you to drill down into the status of each sub-component by clicking on the individual components.
The system has four status levels for each component:
CRITICAL - A failure which will cause the system to not function
FAILED - A failure which may cause some loss of functionality
WARNING - May cause a loss of redundancy
OK - The component is functioning as expected
REST API
The health check is also available via a REST API for easy integration into external monitoring systems. There are two endpoints, the main health check is available under /API/v2/healthcheck/ and returns a json or XML document with the same information as the health check page. This endpoint requires authentication since it can reveal internal information about the system.
In addition to the main health check, a simple version is also available under /API/v2/healthcheck/simple/ which can be used without authentication. This check only tests a limited number of subcomponents which can be tested quickly. This endpoint is suitable to use in for example HAproxy or some other frontend which frequently polls an endpoint to test system availability.
Command line
If you have problem running Cantemo web you can run the health check from the command line:
/opt/cantemo/portal/manage.py health_check
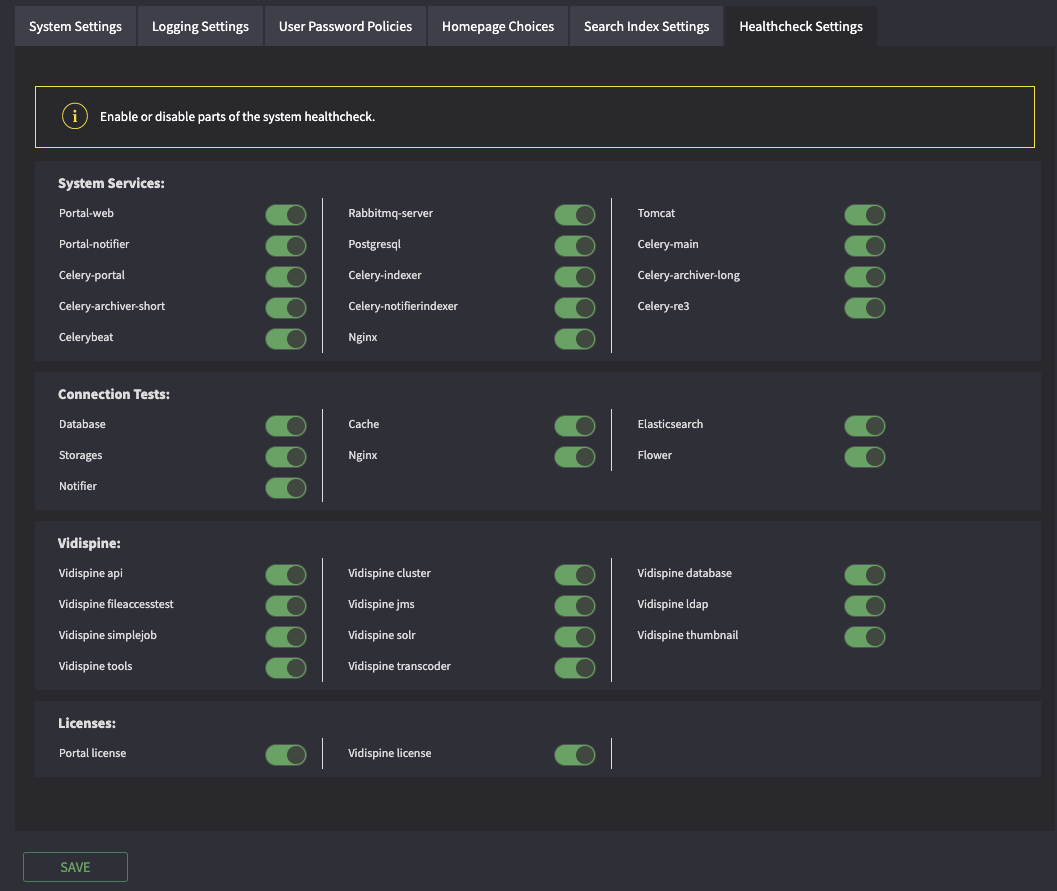
Configuring health checks
There may be reasons why you do not want to monitor certain areas of the system. On the Systems settings page you can configure the System Healthchecks.